Visibility for sponsorship and experiential marketing

Sponsorship decisions run on hype. Yours can run on data.

ForeSpike shows how travel demand shifts around major events and gives you evidence for every budget decision.
Book a demo See how it works
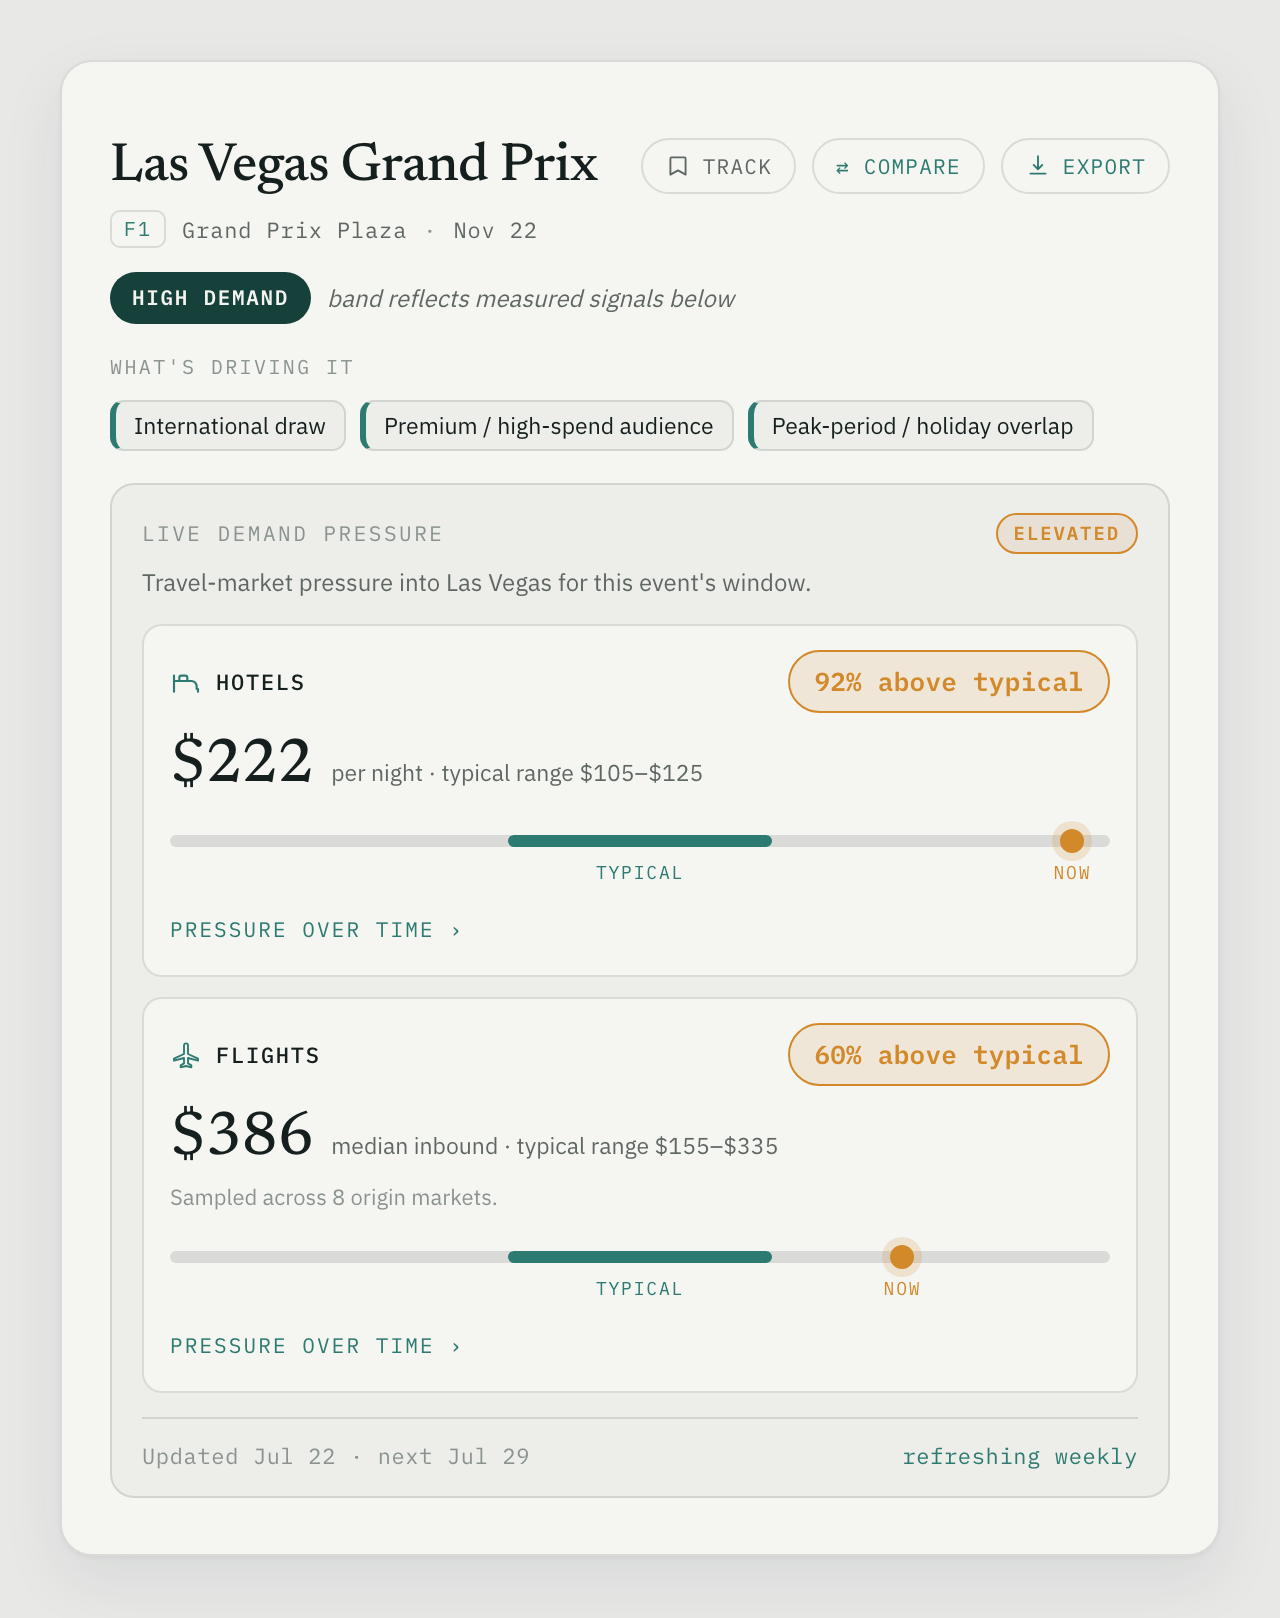
ForeSpike event card for the Las Vegas Grand Prix, showing a high demand band, drivers, and live hotel and flight pressure against typical ranges

See the demand before you commit

Every event pitch promises a massive audience. ForeSpike shows how travel demand actually shifts around major events, measured against each city's baseline, so you know where demand concentrates before any budget is on the table.
Real hotel rates and fares, measured against computed baselines
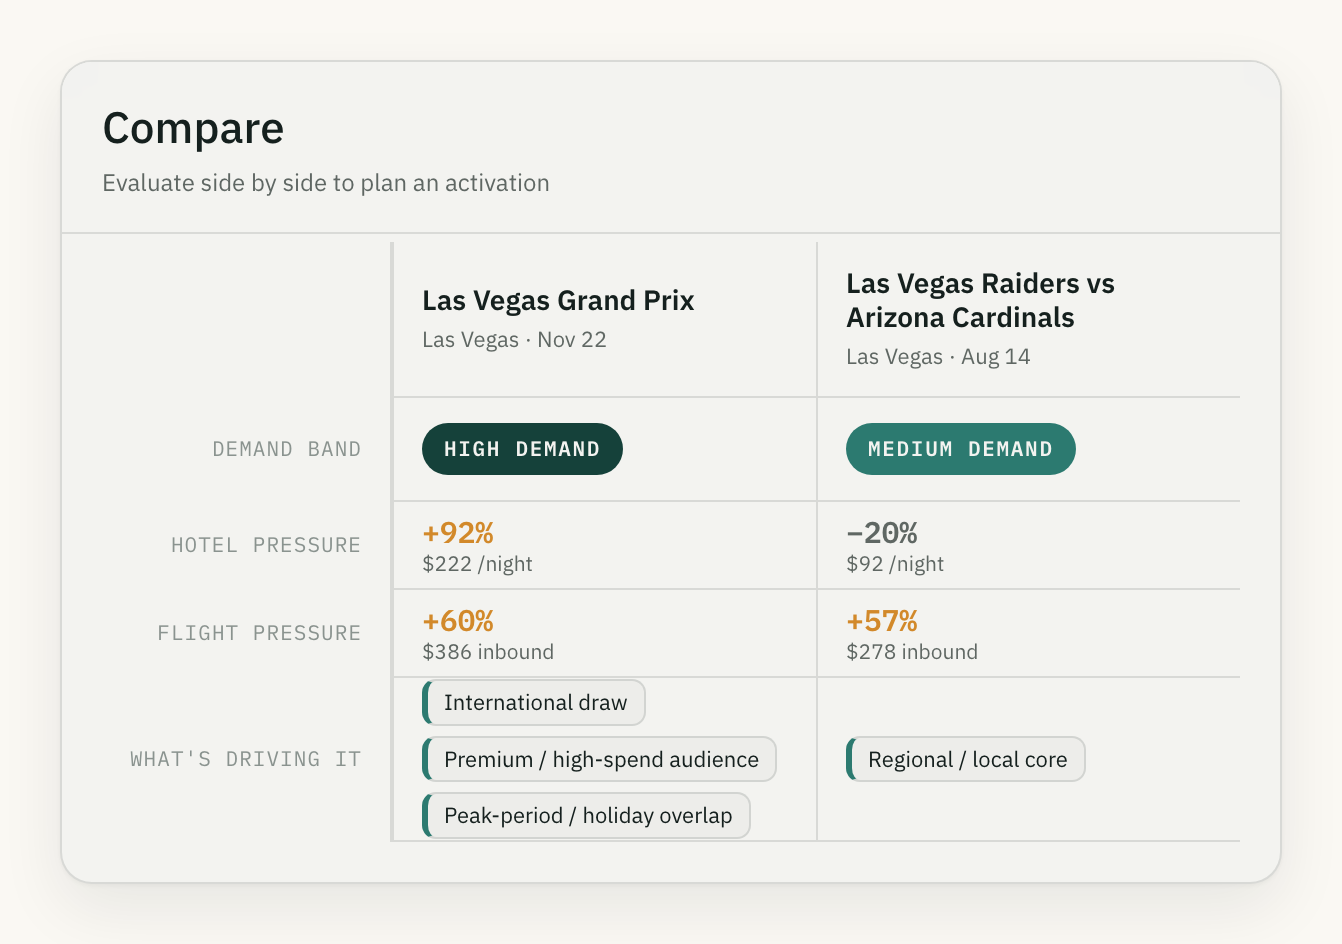
Sports and entertainment in one view
ForeSpike Compare view evaluating the Las Vegas Grand Prix against a Raiders home game side by side, with demand bands, hotel and flight pressure, and drivers

Make the business case with real data instead of vibes

When leadership asks why this event deserves the spend, ForeSpike gives you sourced, methodology-backed numbers that hold up when someone checks. Prices come from commercially licensed API access to Google Flights and Google Hotels data, every figure is measured against that city's own baseline, and nothing claims an event caused what the market did on its own.

Hotel and flight prices from commercially licensed API access to Google Flights and Google Hotels data
Methodology documented
How it works

How we measure and report demand

Measure

Real hotel rates and airfares travelers are being quoted, tracked weekly in every market we cover, through commercially licensed API access.

Baseline

Each market gets its own computed normal. Weeks contaminated by overlapping events are excluded automatically, so the baseline reflects that city and nothing else.

Compare

Event weeks are read against that baseline, so every figure arrives with a reference point: how far above normal this city actually sits, and when.

What ForeSpike deliberately does not do
No causal claims
No estimates presented as facts
No silent revisions (restatements are labeled)

Coverage refreshes weekly, and the full methodology document is available in demos and buyer reviews.

Coverage

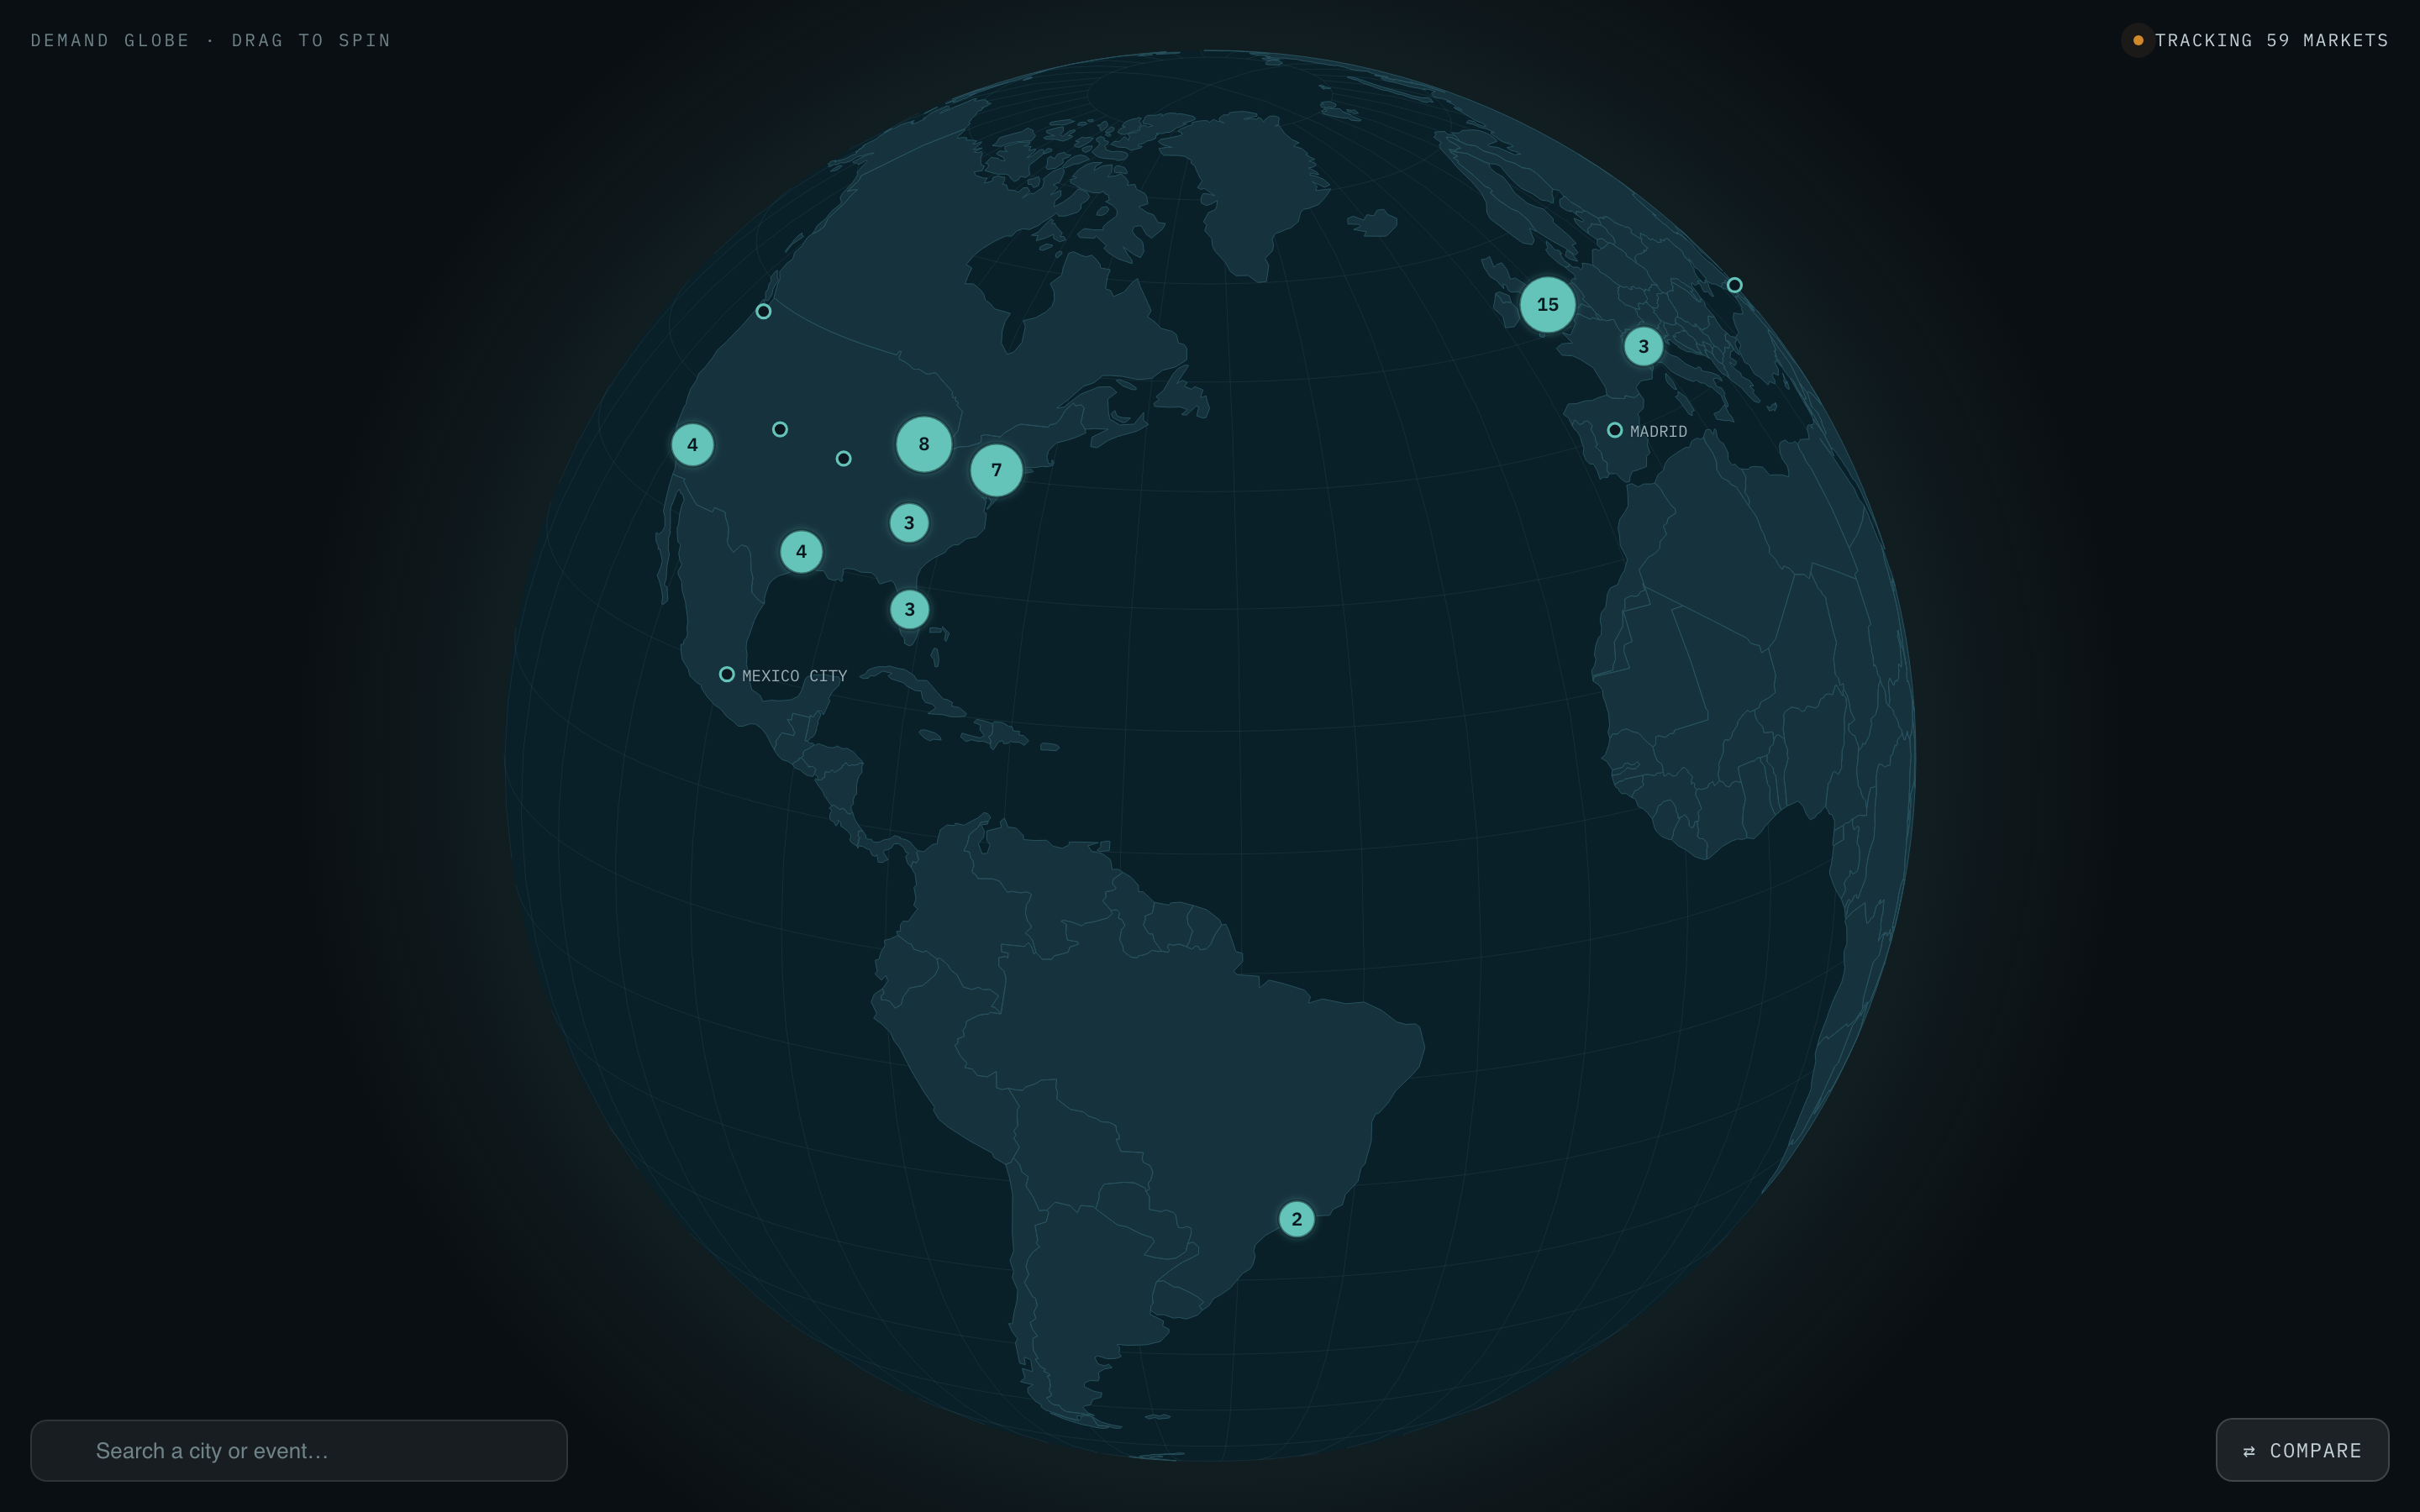
700+ sports and entertainment events in over 50 global markets

Sports and entertainment demand, across cities, in one view.
Updated weekly
ForeSpike demand globe showing tracked markets worldwide with event counts per city
Pricing

The whole product at every tier.

Every plan sees all markets and all events, with unlimited tracking.

Starter

Solo analyst or small shop.

{{ priceStarter }}
Billed annually
1–3 seats
All markets and events
Unlimited tracking, dashboard, movers
2 compare columns
Get started
Most popular

Growth

For teams. Once four or more people need it, this is the tier.

{{ priceGrowth }}
Billed annually
4–9 seats
All markets and events
Unlimited tracking, dashboard, movers
4 compare columns
PDF and image export
Start with Growth

Custom

Large agency, league, or sponsor.

{{ priceCustom }}
Billed annually
10+ seats
All markets and events
Unlimited tracking, dashboard, movers
4 compare columns
PDF and image export
CSV and API access
Talk to us
Compare tiers
Starter
Growth
Custom
Price
{{ priceStarter }}
{{ priceGrowth }}
{{ priceCustom }}
Best for
Solo analyst or small shop
Core team
Large agency, league, or sponsor
Seats
1–3
4–9
10+
Markets and events visible
All
All
All
Tracking, dashboard, movers
Unlimited
Unlimited
Unlimited
Compare columns
2
4
4
PDF and image export
Included
Included
CSV and API
Included

{{ closingLine }}

Book a demo